Showing posts with label Instrumentation Diagrams. Show all posts

Wednesday, October 24, 2018

Instrumentation and Control Symbols

Here we look at common instrument symbols used in various types of technical diagrams that are used to document instrument systems.

Instrument Bubbles
Instrument Bubbles

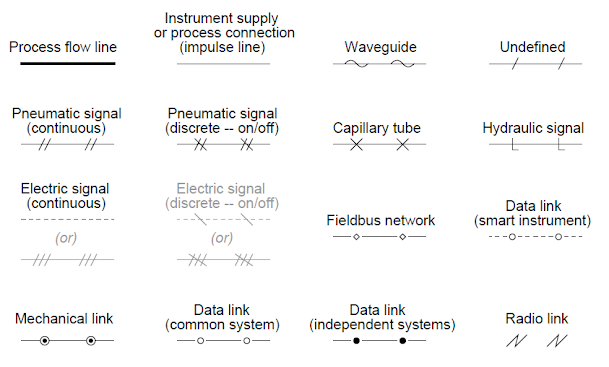
Line Types
Instrumentation Line types Symbols

Note that, the single backlash signifying discrete or binary type has been removed from ISA standard. Regular Pneumatic and Electrical Line Symbols may represent either continuous or discrete states. 

Process/Instrument Line Connections
Process/Instrument line connections


Process Valve Types
Process Valve Types


Valve Actuator Types

Valve Failure Mode
Valve Failure Mode
Liquid Level Measurement Devices
Liquid level measurement devices

Flow Measurement Devices  (Flowing from left to right)
Flow Measurement devices
Flow Measurement Devices

Process Equipment Symbols

Functional Diagrams Symbols
Functional Diagrams symbols

Single-line electrical diagram
single line electrical diagrams
Single-line electrical diagram

Fluid Power Diagram Symbols
You can also read: 

Don't miss out on key updates, join our newsletter list here.

Tuesday, October 23, 2018

Functional Diagrams

Functional Diagrams form part of diagrams used In Instrumentation. In our previous articles, we looked at Process Flow Diagrams, Process & Instrument Diagrams as well as Loop Diagrams.
In this article, we look at a unique form of technical diagram for describing functions comprising a control system (e.g. PID Controllers, Rate Limiters, Manual Loaders). The diagrams used to document control strategies are termed as functional diagrams. Note that, functional diagrams focus on the flow of information within a control system rather than on the process piping or instrument interconnections i.e. wires, tubes etc. The general flow of a functional diagram is top-to-bottom, with the process sensing instrument (transmitter) located at the top and the final control element (valve or variable-speed motor) located at the bottom.
Functional  Diagrams are all about the algorithms used to control decisions, so no attempt is made to have the symbols arranged to  correspond with actual equipment layout. 
Let's consider a functional diagram shown below:
Functional Diagrams

The above functional diagram shows a flow transmitter (FT) sending a process variable signal to a PID Controller, which then sends a manipulated variable to a flow control valve (FCV).
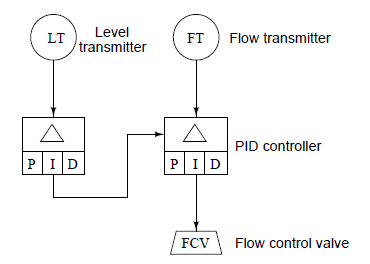
A cascaded control system, where the output of one controller acts as the set-point for another controller to follow, appears in functional diagram as shown below:
Functional Diagram


In the above cascaded control system, the primary controller senses the level in a vessel, commanding the secondary (flow) controller to maintain the necessary amount of flow either in or out of the vessel as needed to maintain level at some point.
Functional diagrams may show varying degrees of detail about the control strategies they document e.g. you may see the auto/manual controls represented as separate entities in a functional diagram, apart from the basic PID controller function. In the following Functional Diagram, a transfer block (T) and two manual adjustment blocks (A) providing a human operator with the ability to separately adjust the controller’s set point and output (manipulated variables) and to transfer between automatic and manual modes:
Functional Diagrams

Rectangular blocks such as the Î”, P, I and D shown in the diagram below represent automatic functions.  Diamond-shaped blocks such as A and T blocks represent manual functions which must be set by a human operator. The Functional diagram also shows the presence of set point tracking in the controller algorithm, a feature that forces the set point value to equal the process variable value any time the controller is in manual mode.
Functional Diagrams

A solid line in a functional diagram represent analog (continuously variable) signals such as process variable, set point, and manipulated variable. Dashed lines represent discrete (on/off) signal paths, in this case the auto/manual state of the controller commanding the PID algorithms to get its set point either from the operator’s input (A) or from the process variable input (the flow transmitter: FT).
Don't miss out on key updates, join our newsletter list here.

Sunday, October 21, 2018

Process and Instrument Diagrams (P & IDs)


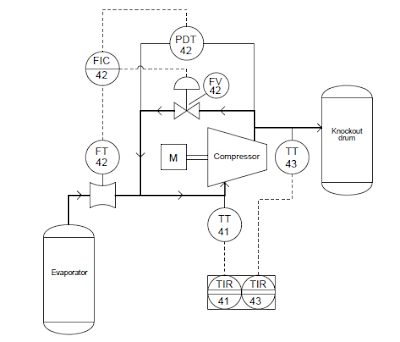
In the previous post, we looked at Process Flow Diagrams (PFDs),  where we indicated that a PFD represents a big picture of the entire process. In this post, we look at the Process and Instrument Diagrams (P & IDs), where we will try to get more details that weren’t shown in the PFD. Let's consider the compressor control system diagram below:
Process and Instrument Diagrams ( P & IDs)

From the above, we can see that there is more instrumentation associated with the compressor than just a flow transmitter. We have the differential pressure transmitter (PDT), a flow indicating controller (FIC), and a recycle control valve (FV42), that allows some of the vapor coming out of the compressor discharge line to go back around the compressor suction line. Also, we have a pair of temperature transmitters (TT41 & TT43) reporting suction and discharge line temperatures to an indicating recorder.
Additional details emerge in the P & ID above, the flow transmitter, flow controller, pressure transmitter and flow valve all bear a common number 42. This common, ”loop number” indicates these four instruments are all part of the same control system. An instrument with any other loop number is part of a different control system, measuring and/or controlling some other function in the process like the two temperature transmitters and their respective recorders, bearing the loop numbers 41 and 43.
You can also read: Process Flow Diagrams
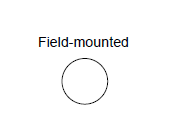
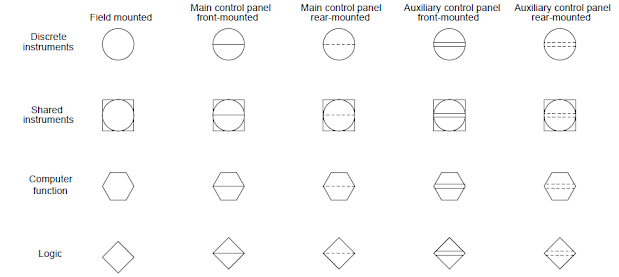
The other information we can derive from the P & ID above, are the different instrument ” bubbles” used. Some of the bubbles are just open circles, while others have lines going through the middle as shown below:
Process and Instrument Diagrams

Process and Instrument Diagrams

Each of these symbols have meaning according to the ISA ( Instrumentation, Systems and Automation Society).
The type of “bubble” used for each instrument tells us something about its location. The rectangular box enclosing box enclosing the temperature recorders (TIR 41 and TIR 43) shows they are part of the same physical instrument i.e. this indicates that there is really only one temperature recorder instrument, and that it plots both suction and discharge temperatures (most likely on the same trend graph). This suggests that each bubble may not necessarily represent a discrete, physical instrument, but rather an instrument function that may reside in a multi-functional device.
The P & ID shows more details than PFD, but we cannot see other details like the cable types, wire numbers, terminal blocks, junction boxes, instrument calibration ranges, failure modes, power sources etc. To examine this level of details, we need to look at the loop diagram.
Don't miss out on key updates, join our newsletter list here.
Saturday, October 20, 2018

Process Flow Diagrams

Instrumentation has its own standardized way of making descriptive diagrams. In this article, we are going to look at the types of diagrams commonly used in industrial instrumentation like the Process Flow Diagrams (PFDs). Essentially we have the following types of instrumentation diagrams:
  • Process Flow Diagrams (PFDs)
  • Process and Instrument Diagrams (P & IDs)
  • Loop Diagrams (Loop Sheets)
  • Functional Diagrams

At the highest level, an instrument technician is interested in the interconnections of process vessels, pipes and flow paths of process fluids therefore he/she would be more likely go for the Process Flow Diagram (PFD), that represent the big picture of the entire process.
At the lowest level, the instrument technician will be more interested in the interconnections of individual instruments including all the wire numbers, terminal numbers, cable types, instrument calibration ranges etc. The proper form of diagram for this level of fine detail is a loop diagram.
Process and Instrument diagrams (P & IDs) lie somewhere in the middle between process diagrams and loop diagrams. A P & ID shows the layout of all relevant process vessels, pipes and machinery, but with instruments superimposed on the diagram showing what gets measured and what gets controlled. You are able to view the flow of the process as well as the flow of information between instruments measuring and controlling the process.
Functional Diagrams are used to document the strategy of a control system. In a functional diagram, emphasis is placed on the algorithms used to control a process, as opposed to piping, wiring, or instrument connections.
An instrument technician has the responsibility of reading the different diagrams when troubleshooting a complex control system. First you begin with a PFD or P&ID to get an overview of the process to see how the major components interact. After identifying which instrument or loop you need to investigate, you go to the appropriate loop diagram to see the interconnection details of that instrument system so that you know where to connect your test equipment and what signals you expect to find when you do so.
Process Flow Diagrams
To help understand better process flow diagrams, we are going to examine the diagrams of a compressor control system. In this process, we assume that water is being evaporated from a process solution under partial vacuum that is being provided by the compressor. The compressor then transports the vapors to a knockout drum where some of them condense into liquid form. As a typical PFD, this diagram shows the major interconnections of process vessels and equipment. But it omits details such as instrument signal lines and auxiliary instruments.
Process Flow Diagram

From the diagram above you might find it hard to determine which control system if any, controls the compressor. All that the PFD shows relating directly to the compressor is a flow transmitter (FT) on the suction line. This level of uncertainty is acceptable for a PFD, because its purpose is merely to show the general flow of the process itself and very little details on Control Instrumentation.
Don't miss out on key updates, join our newsletter list here.