In the previous post, we looked at Process Flow
Diagrams (PFDs), where we indicated that a PFD represents a big
picture of the entire process. In this post, we look at the Process and
Instrument Diagrams (P & IDs), where we will try to get more details that
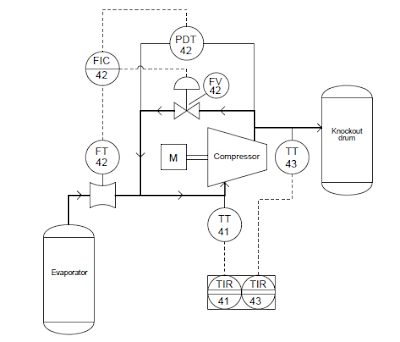
weren’t shown in the PFD. Let's consider the compressor control system diagram
below:
From the above, we can see that there is more
instrumentation associated with the compressor than just a flow transmitter. We
have the differential pressure transmitter (PDT), a flow indicating controller
(FIC), and a recycle control valve (FV42), that allows some of the vapor coming
out of the compressor discharge line to go back around the compressor suction line. Also, we have a pair of temperature transmitters (TT41 &
TT43) reporting suction and discharge line temperatures to an indicating
recorder.
Additional details emerge in the P & ID above,
the flow transmitter, flow controller, pressure transmitter and flow valve all
bear a common number 42. This common, ”loop number” indicates these four
instruments are all part of the same control system. An instrument with any
other loop number is part of a different control system, measuring and/or
controlling some other function in the process like the two temperature
transmitters and their respective recorders, bearing the loop numbers 41 and
43.
You can also read: Process Flow Diagrams
The other information we can derive from the P
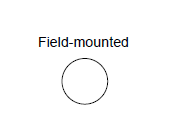
& ID above, are the different instrument ” bubbles” used. Some of the
bubbles are just open circles, while others have lines going through the middle
as shown below:
Each of these symbols have meaning according to the
ISA ( Instrumentation, Systems and Automation Society).
The type of “bubble” used for each instrument tells
us something about its location. The rectangular box enclosing box enclosing
the temperature recorders (TIR 41 and TIR 43) shows they are part of the same
physical instrument i.e. this indicates that there is really only one
temperature recorder instrument, and that it plots both suction and discharge
temperatures (most likely on the same trend graph). This suggests that each
bubble may not necessarily represent a discrete, physical instrument, but
rather an instrument function that may reside in a multi-functional device.
The
P & ID shows more details than PFD, but we cannot see other details like
the cable types, wire numbers, terminal blocks, junction boxes, instrument
calibration ranges, failure modes, power sources etc. To examine this level of
details, we need to look at the loop diagram.
Don't miss out on key updates, join our newsletter list here.


No comments:
Post a Comment