Wednesday, September 26, 2018

How HART Communication Protocol is used in Industrial Measurement

HART (Highway Addressable Remote Transducer) communication protocol is a hybrid of both the analog and digital industrial communication open protocol. HART communicates digital data along the loop conductors in the form of AC signals (audio-frequency tones) superimposed on the 4-20 mA DC current signals. A modem built in the smart transmitter translates these AC signals into binary bits and vice versa.

By connecting a HART communication device at any point along the two-wire cable, any instrument technician can easily configure the transmitter.  Being able to communicate digital data over the same wire pair as the DC power and analog signal makes it possible to communicate self-diagnostics information, alarms, status reports; multiple process variables for example temperature, density etc. to the control system in addition to the original analog signal representing the main process variable. The control system can also communicate to the transmitter using the same digital protocol for example switch between measurement range sets etc. The only limitation of digital communication is the data rate or speed, and not the quantity of the data being transmitted.

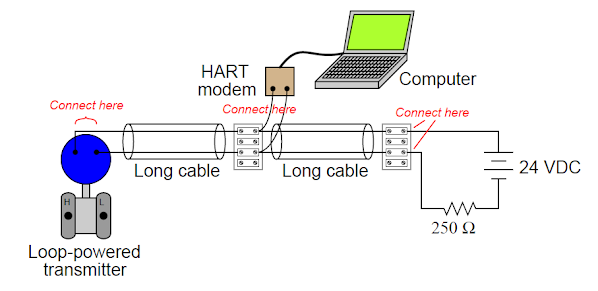
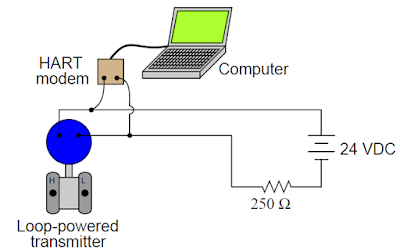
The use of HART doesn’t make any changes to the normal series connected circuit configuration of the transmitter, DC supply, and resistor. A HART enabled transmitter is equipped with a inbuilt digital microcontroller managing its functions, and this microcomputer is able to send and receive digital data as AC signals (current pulses in sending mode, voltage pulses in receiving mode) superimposed on the same two wires carrying the 4-20 mA analog signals and DC power.

Any computer device equipped with a HART modem, the configuration software, device description, for that particular instrument may communicate with the HART transmitter if connected in parallel with the transmitter’s loop power terminals.

How HART Communication Protocol is used In Industrial Control

This external computer through the use of HART data transmission, can now monitor details of the transmitter’s operation, configure the transmitter, make changes to its measurement ranges among other additional functions.
The HART modem can be connected anywhere in the circuit electrically parallel to the HART-enable transmitter’s terminals.

How HART Communication Protocol is applied in industrial Control

This flexibility works to the advantage to the instrument technicians enabling them to connect the HART configuration instrument at the most physical convenient location.
HART communicators are battery powered, portable devices built specifically for configuring HART-enabled field instruments. Like PCs they need to be updated with DD files to be able to communicate with the latest models of HART-enabled field instruments.

Key Features of HART communication Protocol includes:
  • Changes to field instruments ranges can be made remotely with the use of HART communicators.
  • Field instruments may be programmed with identification data e.g. tag numbers, corresponding to plant-wide instrument loop documentation.
  •  Diagnostic data may be transmitted by the field device for example out of limit alarms, preventing maintenance alerts, self-test results etc.
  • Technicians may use HART communicators to force field instruments into different manual modes for diagnostic purposes e.g. forcing a transmitter to output a fixed current so as to check calibration of other loop components, manually stroking a valve equipped with a HART capable positioner.


Merits of HART Protocol
HART technology has allowed new features and capabilities to be added on to existing analog signal loops without having to upgrade wiring or change all the instruments in the loop.
Don't miss out on key updates, join our newsletter list here.

Demerits of HART Protocol
The main disadvantage of HART data communication is the slow speed.  Its bit rate of 1200 bits per second is slow for modern standards.
Tuesday, September 25, 2018

Electrical Power Distribution Automation

Electrical power distribution is the last stage in the delivery of electric power. It carries electricity from the transmission system to the individual consumers. The primary distribution lines carry this medium voltage to distribution transformers.


The distribution networks of concern in this stage are 11KV lines or feeders downstream of the 33KV substations. Each 11KV feeder, which come from the 33KV substation branches further into several subsidiary 11KV feeders to carry power close to the load points, where it is further stepped down to either 230V or 414V.

Electrical Power Distribution Automation

Normally for fault detection, we have circuit breakers i.e. one circuit breaker for every main 11KV feeder at the 33KV substations, but these circuit breakers are provided as a means of protection to completely isolate the downstream network in the event of a fault. For quick fault detection, isolation of faulty region and restoration of supply to the maximum outage area, we need to have a system that can achieve a finer resolution.

In the event of a fault on any feeder section downstream, the circuit breaker at the 33KV substation trips, as a result, we have a blackout over a large section of the distribution network. If we can precisely identify the faulty segment, we can reduce the blackout area, by re-routing the power to the healthy feeder segments through the operation of sectionalizing switches, placed at strategic locations in various feeder segments.

The lack of information at the 33KV substations of the loading and health status of 11KV/415V distribution transformers and associated feeders is one of the main causes of inefficient power distribution.  When we have no monitoring, overloading occurs, which results in low voltage at the customer end, and this increases the risk of frequent breakdowns of the transformers and feeders.
To prevent the above problems from occurring in a power distribution network, we need to have an automated electrical power distribution system.


How Electrical Power Distribution Automated System work

To enhance the electrical power distribution reliability, sectionalizing switches are provided along the way of primary feeders. Thus, by adding fault detecting relays to the sectionalizing switches along with circuit breaker and protective relays at the distribution substations, the system is capable of determining fault sections. To reduce the service disruption area in the case of power failure, normally open (NO) sectionalizing switches called as route switches are used for supply restoration process. The operation of these switches is controlled from the control center through the Remote Terminal Units (RTU).

In a power distribution automation system, the various quantities e.g. current, voltage, switch status, temperature and oil level are recorded in the field at the distribution transformers and feeders, using a data acquisition device called Remote Terminal Unit. These quantities re transmitted on-line to the base station through a communication media. The acquired data is processed at the base station for display at multiple computers through a Graphic user interface (GUI).

In the event of a system quantity crossing a pre-defined threshold, an alarm is generated for operator intervention. Any control action, for opening or closing of the switch or circuit breaker is initiated by the operator and transmitted from the 33KV base stations through the communication channel to the remote terminal unit associated with the corresponding switch or CB. The desired switching takes place and the action is confirmed by the operator.

All these distribution automation functions of data collection, data transmission, data monitoring, data processing, man-machine interface etc. are realized using an integrated distribution SCADA (Supervisory Control and Data Acquisition) system.

Don't miss out on key updates, join our newsletter list here.

The implementation of SCADA system in any electric utility involves the installation of the following units:
  • Sectionalizing Switches
  • Remote Terminal Units
  • Data Acquisition System
  • Communication Interface
  • Control PC

Monday, September 24, 2018

The use of Smart Sensors in Industrial Control

A smart sensor is the integration of a processor directly into the sensor assembly, which gives direct control of the actuator and digital communication to a central controller i.e. it, allows for the direct conversion of an analog signal to a digital signal, conditioning of the signal, generation of a signal for actuator control, and diagnostics.

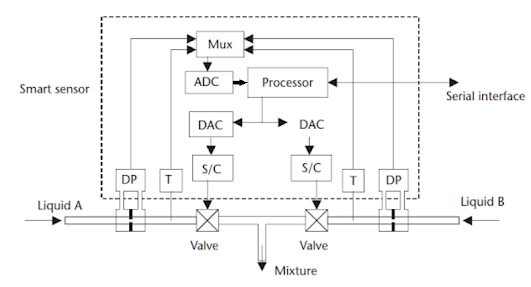
Let’s consider the following diagram:

Smart sensor


The above diagram represents a process where they are mixing two liquids in a fixed ratio, the flow rates of both liquids are monitored using differential pressure sensors (DP). The temperatures of the liquids are monitored to correct the flow rates for density changes and any variations in in the sensitivity of the DP cells using Temperature sensors (T),
The electronics in the smart sensor contains all the circuits necessary to interface to the sensor, amplify and condition the signal, and apply proportional, integral and derivative action (PID).
When the usage is varying, the signals from the sensors are selected in sequence by the multiplexer (Mux), and then converted by the ADC (Analog to Digital Converter) into a digital format for the internal processor.
After signal evaluation by the processor, the control signals are generated, and the DACs (Digital to Analog Converters) are used to convert the signal back into analog format for actuator control.
Communication between the central control computer and the distributed devices is via a common serial bus.
The serial bus or Fieldbus is a single twisted pair of leads used to send the set points to the peripheral units and to monitor the status of the peripheral units. This enables the processor in the smart sensor to receive updated information on factors such as set points, gain, operating mode etc. and to send status and diagnostics information back to the central computer
Smart sensors are available for all the functions required in process control, such as flow, temperature, humidity, pressure and level control.


The implementation of smart sensors has the following advantages over central control systems:
  • Smart sensors use a common serial bus eliminating the need for discrete wires to all sensors, greatly reducing the wiring cost, large cable ducts, and confusion over lead destination during maintenance or upgrades.
  • The smart sensor takes over the conditioning and control of the sensor signal reducing the load on the central control system, allowing for faster system operation.
  • Uniformity in programming means that the program only has to be learned once and new devices can be added to the bus on a plug and play basis.
  • Individual controllers can monitor and control more than one process variable.
  • Smart sensors have a powerful inbuilt diagnostics, which reduces commissioning, and start-up costs and maintenance.
  •        The set points and calibration of a smart sensor are easily changed from the central control computer. 
  •    Direct digital control provides high accuracy, not achievable with analog control systems and central processing.
  •    The cost of smart sensor systems is higher than the conventional systems, but when the cost of maintenance, ease of programming, ease of adding new sensors is taken into account, the long term cost of sensor system is less. 

Limitations of Smart sensors
Since these sensors are connected to a common serial bus, if the bus fails, the total system is down, which is not the case with discrete wiring; this problem can be prevented by use of a redundant backup bus.
Don't miss out on key updates, join our newsletter list here.

Sunday, September 23, 2018

Principle of Operation of Positive Displacement Flowmeters

Positive displacement flowmeters have a cyclic mechanism designed to pass a fixed volume of fluid through with every cycle.
Every cycle of the meter’s mechanism displaces a precisely defined (positive) quantity of fluid, so that a count of the number of mechanism cycles yields a precise quantity for the total fluid volume passed through the flowmeter.
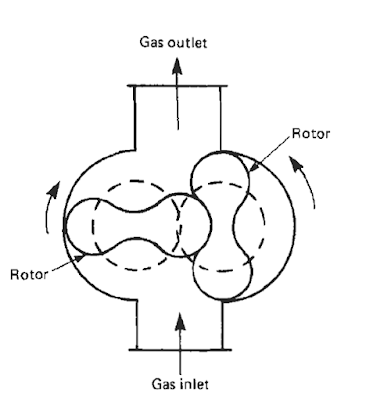
Example of Rotary Displacement flowmeter is shown below:

Rotary Displacement Meter


Each shaft revolution in a Rotary Displacement flowmeter represents a certain volume of fluid that has passed through the meter.
Besides, Rotary Displacement flowmeters, we have other types like Diaphragm meter (Bellows type), Liquid sealed drum (wet gas meter), Pistons etc.

Advantages of using Positive Displacement Flowmeters

Positive displacement flowmeters are immune to swirl and other large-scale fluid turbulence, and can be installed anywhere in a piping system. There is no need for long sections of straight of straight-length pipe upstream or downstream as with the case of Ultrasonic Flowmeters. Positive displacement flowmeters are also very linear, since the mechanism cycles are directly proportional to fluid volume.

Limitations of Positive Displacement Flowmeters

The sealing surfaces of rotating mechanisms are subject to wear and accumulating inaccuracies over time. The finely machined construction of a positive displacement flowmeter can suffer damage from abrasive materials like grit present in the fluid, meaning that these types of flowmeters are only used for clean fluid flow streams.


Applications of Positive Displacement Flowmeters
Positive displacement meters are commonly used for custody transfer of gas. Positive Displacement meters can measure high viscosity clean liquids as high as 1 Million centipoise, they also find application in water flow measurement.
Don't miss out on key updates, join our newsletter list here.

Saturday, September 22, 2018

The Working Principle of Ultrasonic Flowmeters

Ultrasonic Flowmeters measure the velocity of a flowing medium by monitoring the interaction between the flow stream and an ultrasonic sound wave transmitted through it.

The main techniques used are:
  •  Doppler
  • Time of flight/Transit-time
Doppler Flowmeters
These types of ultrasonic flowmeters use Doppler Effect which states that the frequency of sound changes if its source or reflector moves relative to the listener or monitor. The magnitude of the frequency change is an indication of the speed of the sound source or sound reflector.
Doppler flowmeter comprises a housing in which two piezoelectric crystals are potted, one being the transmitter and the other a receiver. This whole assembly is located on the pipe wall as shown below:

Principle of Operation of Doppler flowmeter

The transmitter transmits ultrasonic waves of frequency F1 at an angle Ï´ to the flow stream. If the flow stream contains particles, entrained gas or other discontinuities, some of the transmitted energy will be reflected back to the receiver. If the fluid is travelling at a velocity V, the frequency of the reflected sound as monitored by the receiver can be shown to be F2 such that:
Principle of operation of doppler flowmeters-Equation

Where C is the velocity of sound in the fluid.
Rearranging the equation:

Principle of operation of doppler flowmeters equation

Which show velocity is proportional to the frequency change.

Applications of Doppler flowmeters

The Doppler flowmeter is normally used as an inexpensive clamp on flowmeter. The only operational constraints being that the flows stream must contain discontinuities of some kind, without which the device won’t work. Note the device cannot monitor clear liquids. For the Doppler flowmeter to work, the pipeline must be able to transmit acoustic signals.
Doppler flowmeter is mostly used as a flow switch or for flow indication where the absolute accuracy is not required.

Time of Flight Flowmeters

Ultrasonic flowmeters that use time of flight technique differ from Doppler flowmeters in that they rely on transmission of an ultrasonic pulse through the flow stream and therefore do not depend on the discontinuities or entrained particles in the flow stream for operation.
The principle of operation is based on the transmission of an ultrasonic sound wave between two points, first in the direction of flow, and then in the opposing flow. In each case the time of flight of the sound wave between the two points will have been modified by the velocity of the flowing medium and the difference between the flight times can be shown to be directly proportional to the flow velocity.
The sound waves are not generated in the direction of flow but at an angle across it as shown below:

Principle of operation of Time of flight ultrasonic flowmeters

Pulse transit times downstream T1 and upstream T2 along the path length D can be expressed as:
T1 = D/(C + V) and T2 = D/(C –V), where C is the velocity of sound in the fluid and V is the fluid velocity.
Now, T = T1 – T2 = 2DV/ (C2 V2)  (equation 1)
Since V2 is very small compared to C2 it can ignored. It is convenient to develop the expression in relation to frequency and remove the dependency on the velocity of sound C.
Since F1 = 1/T1   and F2 = 1/T2 and the average fluid velocity Vav = V/ (cosÏ´)
Replacing T1 and T2   in equation 1 with respective Frequencies, we get:
F1  - F2  = (2Vav cosÏ´)/D
The frequency difference is calculated by an electronic converter which gives an analog output proportional to average fluid velocity.
In practice, the piezoelectric ceramic transducers used act as both transmitters and receivers of the ultrasonic signals and thus only one is required on each side or the pipe.
Typically the flowmeter consists of a flow tube containing a pair of externally mounted transducers and a separate electronic converter/transmitter. Transducers may be wetted or non-wetted and consist of a piezoelectric crystal sized to give the desired frequency (typically 1 – 5 MHz for liquids and 0.2 -0.5 MHz for gases.

Advantages of ultrasonic Flowmeters

The unique advantage of ultrasonic flow measurement is the ability to measure flow through the use of temporary clamp-on sensors rather than a specialized flow tube with built in ultrasonic transducers.
Some modern ultrasonic flowmeters have the ability to switch back and forth between Doppler and transit-time (counter propagation) modes, automatically adapting to the fluid being sensed. This capability enhances the suitability of ultrasonic flowmeters to a wider range of process applications.

Limitations of Time of Flight Ultrasonic Flowmeters

Due to the fact that the flowmeter measures velocity across the center of the pipe, it is susceptible to flow profile effects and care should be taken to ensure there is sufficient length of straight pipe upstream or downstream of the flow tube to minimize this kind of effects.
To overcome this problem, manufacturers use multiple beam techniques where several chordal velocities are measured and the average computed, but note that, since ultrasonic flowmeters are easily affected by swirl and other large scale fluid disturbances, it is advisable to ensure an approximately 10 upstream and downstream diameters of straight pipe of the measurement flow tube, when installing them, this helps to stabilize the flow profile.
Also since this type of flowmeter relies on transmission through the flowing medium, fluids with a high solids or gas-bubble content cannot be measured well using ultrasonic meters.

Applications of Ultrasonic Flowmeters

Ultrasonic flowmeters are used in various industrial process measurement applications, and some of them include:
  • Measurement of both conductive and non-conductive liquids
  •  Measuring aqueous liquids as well as extreme viscous oils
  •  Measuring multiple products e.g. allocation measurements in on/off loading
  • The are used in all process industries: make up water, demineralized water, boiler feed water etc.
  • They are also considered for custody transfer natural gas

Don't miss out on key updates, join our newsletter list here.

Thursday, September 20, 2018

The Working Principle and Applications of Vortex Flowmeters

Vortex flowmeters are used to measure the flow of Gases, Vapours and liquids in completely filled pipes. The measuring principle behind vortex flowmeters is based on the Karman vortex street.
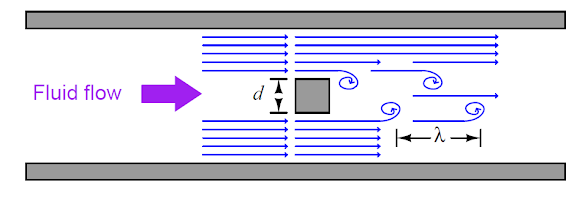
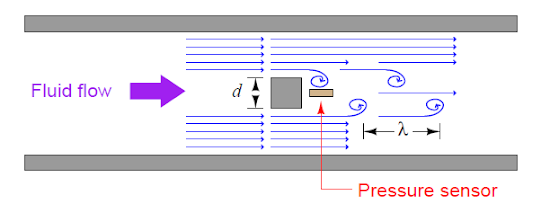
When a fluid moves with a high Reynolds number past a stationary object (a bluff body) there is tendency for the fluid to form vortices on either side of the object. Each vortex will form, then detach from the object and continue to move with the flowing gas or liquid, one side at a time in alternating fashion. This phenomenon is known as vortex shedding, and the pattern of moving vortices carried downstream of the stationary object is known as a vortex street.
From the research that was first done by Vincenc Strouhal then later on, by Theodore Von Karman, It was established that the distance between the successive vortices downstream of the stationary object is relatively constant, and directly proportional to the width of the object, for a wide range of Reynold number values.
The working Principle of Vortex Flowmeters

If consider these vortices as crests of a continuous wave, the distance between vortices may be represented by the symbol of wavelength ‘’lambda’’ (λ)


d- Object width
λ- Vortex street wavelength
S- Strouhal number
(λS = d) where S is approximately equal to 0.17
The wavelength (λ) is equivalent to d/0.17
If a differential Pressure sensor is installed immediately downstream of the stationary object in such an orientation that it detects the passing vortices as pressure variations, an alternating signal will be detected.
Working Principle of Vortex Flowmeters

The frequency of this alternating pressure signal is directly proportional to fluid velocity past the object, since the wavelength is constant.
Using the classic frequency velocity wavelength formula common to all travelling waves; λf = v, and since we know the wavelength from the above, we may substitute this into this formula.
Velocity (v) = wavelength (λ) x Frequency (f),
Velocity (v) = d/0.17 x f
Therefore, frequency (f) = 0.17v/d
Therefore the stationary object and pressure sensor installed in the middle of the pipe section constitute a flowmeter called a Vortex flowmeter; the output frequency of a vortex flowmeter is linearly proportional to volumetric flow rate.
The pressure sensors used in vortex flowmeters, are typically piezoelectric crystals.
The relationship between sensor frequency (f) and volumetric flow rate (Q) may be expressed as proportionality, with the letter k used to represent the constant of proportionality for any particular flowmeter:
Therefore, f = kQ
Where f = Frequency of output signal (Hz)
             Q =Volumetric flow rate (e.g. liters per second or gallons per second etc.)
             K = ‘’K’’ factor of the vortex shedding flow tube (e.g. pulses per gallon or pulses per a liter)
Each vortex flowmeter has a ‘’k’’ factor relating to the number of pulses generated per unit volume passed through the meter.
Counting the number of pulses over a certain time span yields total fluid volume passed through the meter over the same time span, making the vortex flowmeter readily adaptable for totalizing fluid volume.
The direct proportion between vortex frequency and volumetric flow rate means vortex flowmeters are linear-responding instruments.

Advantages of using Vortex Flowmeters
Vortex flowmeters have a wide turn down ratio or a wide range of flow measurement. They do not require signal characterization to function properly. Since they have no moving parts, they do not suffer the problems of wear and lubrication facing turbine or positive displacement meters and can measure erratic flows.

Disadvantages of using Vortex Flowmeters
The flowmeter may stop working below certain flow rate, known as low cut off. This is because, at low flow rates i.e. laminar flow (low Reynolds number values), fluid viscosity becomes sufficient to prevent vortices from forming, causing the vortex flowmeter to register zero flow even when there may be some flow in the pipe.

Industrial Applications of Vortex Flowmeters
Vortex flowmeters are used in measurement of saturated steam and super-heated steam. They are also used in measurement of consumption of industrial gases. You will find them commonly used in Steam boiler monitoring, measurement of consumption in compressed air systems, heat metering in steam & hot water and lastly in  SIP and CIP processes in the food, beverage and pharmaceutical industries among other areas not mentioned here. 

Don't miss out on key updates, join our newsletter list here.

Wednesday, September 19, 2018

Flow Control Valves

Flow control valves forms an important component of any industrial instrumentation system and control system. When a change in a measured variable with respect to a reference has been sensed, it is necessary to apply a control signal to an actuator to make the corrections to an input controlled variable for example via a valve bringing the measured variable back to its preset value.
In most cases, any change in the variables e.g. Temperature, Pressure, and Level) can be corrected by controlling the flow rates. The actuators used to control valves for flow rate control can be electrically, pneumatically or hydraulically controlled.
Actuators can be self-operating in local feedback loops. The two most common types of variable devices used for flow control are the globe valves and the butterfly valve.

Globe Valve
Let’s consider the following diagram:
Globe Valve

The actuator controlling the valve can be controlled or driven electrically, pneumatically or hydraulically.
The actuator determines the speed of travel and the distance that the valve shaft travels.
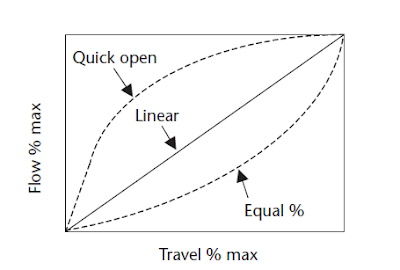
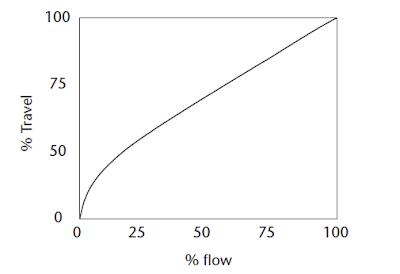
We have various Globe valve configurations. The globe valve can be designed for quick opening operation, for equal percentage operation or with a linear relationship between flow and lift or any combination of these. We also have other configurations like two-way valve (diverging type) and three-way valve.
Globe Valve Configurations

The selection of the type of control plug depends on a careful analysis of the process characteristics. If the load changes are linear, then a linear plug should be used; conversely, if the load changes are nonlinear, then a plug with the appropriate nonlinear characteristics should be use.
Other types of Globe valves include: Needle valve, which has a diameter of 1/8 to 1 inch size. The balanced cage-guided valve and the split body valve.
Note: Globe valves aren’t suitable for use with slurries.
A butterfly valve consists of a cylindrical body with a disk the same size as the internal diameter of the valve body, mounted on a shaft that rotates perpendicular to the axis of the body.
Butterfly Valve

The relationship between flow and lift is approximately 50 % open, after which it is linear.
Properties of Butterfly Valves

Butterfly valves offer high capacity at low cost. They are also simple in design, are easy to install and have tight closure. The torsion force on the shaft increases until the valve is open 70° then reverses.
Butterfly valves have a limited pressure range, and are not used for slurries.
Don't miss out on key updates, join our newsletter list here.

Tuesday, September 18, 2018

Temperature Transducers

We have four common temperature sensors used in industrial instrumentation.
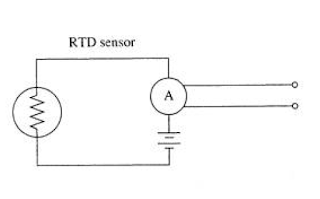
Resistance Temperature Detector (RTD)
RTD responds to heat by increasing its resistance to electric current.
Resistance Temperature Detector
Properties of Resistance Temperature Detector


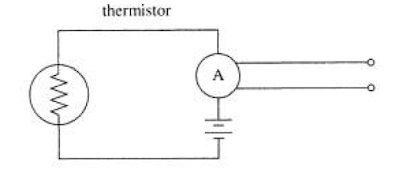
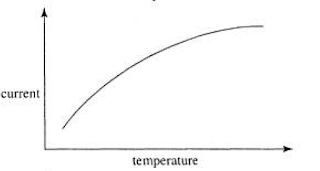
Thermistor
This is similar to RTD, except that its resistance decreases as it is heated.
Note that, in both the RTD and Thermistor temperature sensors, the current variation due to temperature change is usually very small. Current through an RTD or Thermistor must be compared to current through another circuit containing identical devices at a reference temperature to detect the change. The freezing temperature of water is used as the reference temperature.
Thermistor temperature sensor
Properties of thermistors


Semiconductor integrated circuit
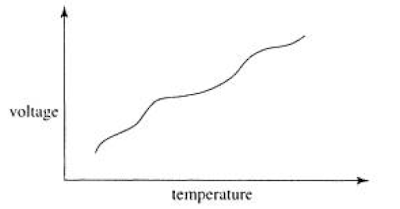
This type of temperature sensors respond to temperature increases by increasing reverse-bias current across P-N junctions, generating a small but detectable current or voltage proportional to temperature. The integrated circuit may contain its own amplifier.
Integrated circuit temperature sensor
Properties of integrated circuit temperature sensor


Don't miss out on key updates, join our newsletter list here.

Thermocouple
Thermocouple type temperature sensors generate a small voltage proportional to the temperature at the location where dissimilar metals are joined.
Thermocouple temperature sensor
Thermocouple temperature sensor properties


The Working Principle of Coriolis Flowmeters

Critical process control applications require highly accurate measurement instruments. Coriolis flowmeters are one of the most accurate process measurement instruments and commonly applied in some of these applications.

Working of Coriolis Flowmeters
To help you understand the principle behind the Coriolis flowmeters, we will strive to make it as simple as possible.
Coriolis flowmeters works by shaking one or more tubes carrying the flowing fluid, then precisely measuring the frequency and phase of that shaking.
The back and forth shaking is driven by an electromagnetic coil, powered by an electronic amplifier circuit to shake the tube(s) at their mechanical resonant frequency.
Since this frequency depends on the mass of each tube, and the mass of the tubes depends on the density of the fluid filling the fixed volume of the tubes, the resonant frequency becomes an inverse indication of the fluid density whether or not the fluid is flowing through the tubes.

-Tube Frequency is inversely proportional to the Density

As the fluid begins to move through the tubes, the inertia of the moving fluid adds another dimension to the tube’s motion: the tubes begin to undulate i.e. twisting slightly instead of just shaking back and forth.
Coriolis Flowmeter working Principle

This twisting motion is directly proportional to the mass flow rate, and is internally measured by comparing the phase shift between motion at one point on the tube versus another point: the greater the undulation or twisting, the greater the phase shift between these two point’s vibrations.

-Tube twisting is directly proportional to Mass Flow rate

Temperature changes have the potential to interfere with density measurement that is why all Coriolis Flowmeters are equipped with RTD temperature sensors to continuously monitor the temperature of the vibrating tubes. The flowmeter’s microprocessor takes the tube’s temperature measurement and uses it to compensate for the resulting elasticity changes based on a prior modelling of the tube metal characteristics. This temperature measurement happens to be accessible as an auxiliary output signal, meaning that, Coriolis flowmeter may also work as a temperature transmitter in addition to measuring mass flow rate, and fluid density.
The ability of Coriolis flowmeter to measure three process variables i.e. Mass flow rate, Temperature and density makes it a very versatile instrument. This makes it easy to communicate in digital environment involving Foundation Fieldbus or Profibus Standard rather than the analog 4-20 mA signal. Fieldbus communication allows multiple variables to be transmitted by the device to the host system or on the same Fieldbus network.

The Advantages of Coriolis Flowmeters
Coriolis flowmeters are very accurate instruments, and reliable. They are completely immune to swirl and other fluid disturbances, hence they can easily be located anywhere in a piping system with no need for straight run pipe lengths upstream or downstream of the flowmeter. The ability of Coriolis flowmeter to measure true mass flow, along with their characteristic linearity and accuracy, makes them ideally suited for custody transfer applications, where the flow of fluid represents product being bought or sold.
The main disadvantage of Coriolis flowmeters is the high cost compared to other flowmeters especially for large pipe sizes. They have also more limited in operating temperature than other types of flowmeters and may have difficulty measuring low-density fluid -gases and mixed-phase i.e. liquid/vapor flows.  The bent tubes used to sense process flow may also trap process fluid inside to the point where it becomes unacceptable for hygienic applications e.g. Food Processing, Pharmaceuticals. That is why; we have new Coriolis tube design to try to overcome some of these problems. Straight-tube Coriolis flowmeters are slightly better than U-shaped tubes however U-shaped tubes aren’t as stiff as straight tubes, and so straight tube Coriolis flowmeters tend to be less sensitive to low flow rates than U-tube designs.

Monday, September 17, 2018

Ultrasonic Level Measurement

Ultrasonic or sonic waves are used in single or continuous level measurement of a liquid or a solid. Ultrasonic waves are also called ultrasound.
Let’s consider the following diagram:
Ultrasonic level measurement

A pulse of sonic waves at approximately 10 kHz or ultrasonic waves at more than 20 kHz from the transmitter is reflected from the surface of the liquid to the receiver, and the time for the echo to reach the receiver is measured. The time delay gives the distance from the transmitter and receiver to the surface of the liquid, and from which the liquid level can be calculated. Since we know the velocity of ultrasonic waves to be around 340 m/s, we can easily calculate the round-trip distance from the transmitter to liquid level and back to the transmitter using the formula: Distance=Velocity X Time
With round-trip distance determined, we can determine the height of the liquid level using the Tank’s height.
Since there is no contact with the liquid, this method can be used for solids, corrosive and volatile liquids.

You can also read: 


Advantages of Sonic and Ultrasonic Devices

Sonic and ultrasonic devices are reliable, accurate and cost effective. They can be used in high humidity, they have no moving parts, and are unaffected by material density or conductivity.

Some of the disadvantages of these Devices includes:

Vibration or high noise levels can affect these devices. Dust can also give false signals or attenuate the signals by deposit build up on the transmitting and receiving devices.

Application
Ultrasonic and sonic devices find common use in Food and Beverage industries where we have liquid level measurement applications; they are also used in Water and wastewater, Pharmaceutical industries etc.

Note: Care should be taken not to exceed the operating temperature of the devices, and correction may be required for the change in velocity of the sonic waves with humidity, temperature and pressure.
Don't miss out on key updates, join our newsletter list here.

Foundation Fieldbus and Profibus

Before we look at Foundation Fieldbus (FF) and Profibus let’s find out why digital signals are commonly used in industrial data transmission.
Digital signals can be transmitted without loss of integrity, via a hardwired parallel or serial bus, radio transmitter or fiber optics.
Digital data transmission speeds are higher than with analog data transmission.

Digital signals can be transmitted without loss of accuracy and can contain codes for limited automatic error correction or for automatic requests of data retransmission.
Digital transmitters consume less power as compared to analog transmission devices hence they are preferred for use in industrial communication systems over analog devices.

Foundation Fieldbus and Profibus
The Foundation Fieldbus (FF) and Profibus are the two most universal serial data bus formats that have been developed for interfacing between central processor and smart sensing devices in a process control system.
The FF is primarily used in the USA and the Profibus is primarily used in Europe.
Process control equipment is presently manufactured to accept either of these formats.
A serial data bus is a single pair of twisted copper wires, which enables communication between a central processing computer and many monitoring points and actuators when Smart Sensors are used.
Foundation Fieldbus Cable Connection

Although initially more expensive than direct lead connections, the advantages of the serial bus include: Minimal bus cost and installation labour. The system replaces the leads to all the monitoring points by one pair of leads. New units can be added to the bus with no extra wiring i.e. plug and play feature, giving faster control. Programming is also the same for all the systems.
The accuracies achieved are higher than from using analog, and more powerful diagnostics are available.
The bus system uses time division multiplexing, in which the serial data word from the central processor contains the address of the peripheral unit being addressed in a given time slot, and the data being sent.
In the FF, current from a constant current supply is digitally modulated. Information on the FF is given in the ISA 50.02 standards.
One drawback of the FF is that a failure of the bus, such as a broken wire, can shut down the entire process, where with the direct connection method, only one sensor is disabled. This disadvantage can be overcome by the use of a redundant or backup bus in parallel to the first bus, so that if one bus malfunctions, then the backup bus can be used
Don't miss out on key updates, join our newsletter list here.